coclust.visualization.plot_delta_kl()
-
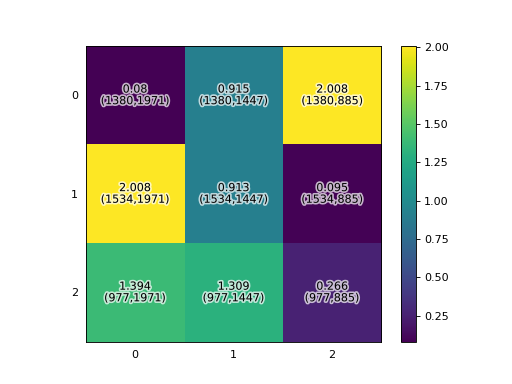
coclust.visualization.plot_delta_kl(model, colormap=<matplotlib.colors.ListedColormap object>, labels='012')[source]¶ Plot the delta values of the Information-Theoretic Co-clustering.
Parameters: - model (
coclust.coclustering.CoClustInfo) – The fitted co-clustering model - colormap (
matplotlib.colors.Colormap) – Color map - labels – Labels
Example
>>> plot_delta_kl(model)
(Source code, png, hires.png, pdf)

- model (