coclust.visualization.plot_max_modularities()
-
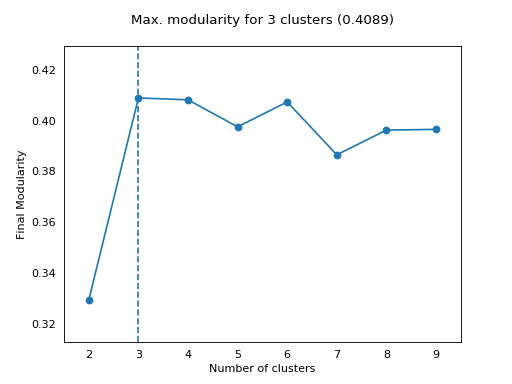
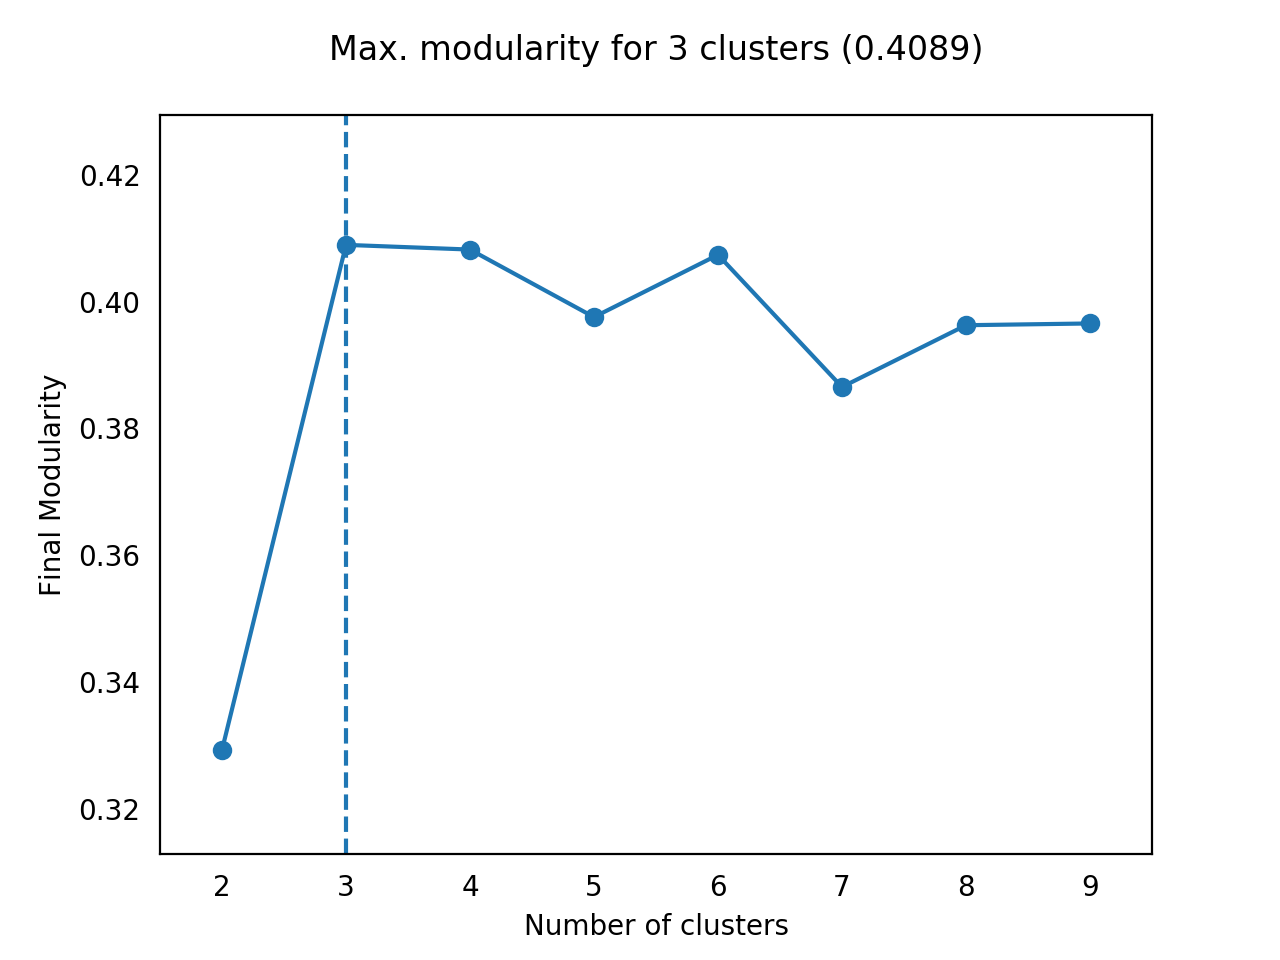
coclust.visualization.plot_max_modularities(max_modularities, range_n_clusters)[source]¶ Plot all max modularities obtained after a series of evaluations. The best partition is indicated in the graph and main title.
Parameters: - max_modularities (list of float) – Final modularities for all evaluated partitions
- range_n_clusters (list) – Number of clusters for which the algorithm is to be executed
Example
>>> plot_max_modularities(all_max_modularities, range_n_clusters)
(Source code, png, hires.png, pdf)