coclust.visualization.plot_cluster_top_terms()
-
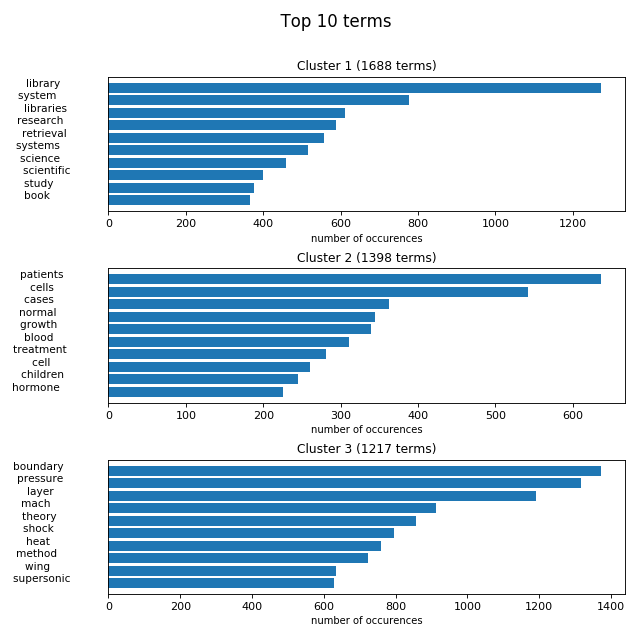
coclust.visualization.plot_cluster_top_terms(in_data, all_terms, nb_top_terms, model)[source]¶ Plot the top terms for each cluster.
Parameters: - in_data (numpy array or scipy sparse matrix, shape=(n_samples, n_features)) –
- all_terms (list of string) – list of all terms from the original data set
- nb_top_terms (int) – number of top terms to be displayed per cluster
- model (
coclust.coclustering.BaseDiagonalCoclust) – a co-clustering model
Example
>>> plot_cluster_top_terms(in_data, all_terms, nb_top_terms, model)
(Source code, png, hires.png, pdf)